What’s your default strategy worth?
14 Jun 2021
DC members have 3 levers at their disposal to improve their outcomes in retirement: They can contribute more, retire later, or change their investment strategy. For the average member, contributions and retirement age are easy to understand, but investment strategy isn’t. That’s one of the reasons more than 90% of DC members invest in the default strategy1. For many, it’s a leap of faith; they rely on the design of the default glidepath to help them achieve their retirement goals.
We see a lot of glidepaths at Hymans Robertson, some of which support better member outcomes than others. But what are the consequences of investing in one strategy over another, and what might it mean for members?
Quantifying the value of an investment strategy
To help answer that question, let’s consider 2 strategies targeting drawdown:
- Strategy 1 is our view of a well-designed glidepath, and
- Strategy 2 is a “could do better” glidepath based on the spectrum of strategies we see across the DC market.
Our Guided Outcomes (GOTM) technology can model the potential retirement outcomes of different members and, for the purpose of this exercise, I’ve considered a 25-year-old member, earning £30k p.a. and planning to retire at their State Pension Age (SPA) of 68, at which point they’ll be entitled to the full basic State Pension.
I calculated the total contribution rate required by the member to have at least a 50/50 chance of achieving the PLSA Moderate Retirement Living Standard2 under each strategy. Not great odds, I know, but I’ll get to that later!
The results are shown in the table and allow us to express the value of investment strategy in the currency of contribution rate, which is well understood by members.

We can look at things another way. Let’s assume the member’s annual total contribution rate is 12% and calculate when they might be able to retire if their target (the PLSA Moderate Standard) remains unchanged.

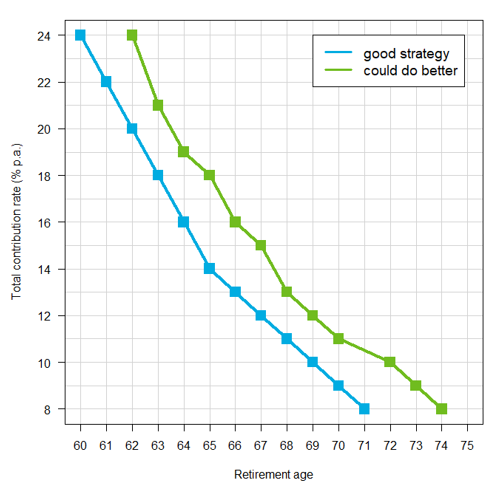
The next chart builds on our previous efforts and illustrates the different combinations of contribution rate and retirement age that give this member the same chance of achieving their target under the different strategies. I call these charts GO Frontiers.

For example, the chart shows that a member with a good investment strategy could:
Contribute 11% and plan to retire at 68 OR Contribute 14% and plan to retire at 65
For the member whose strategy needs work, the choice is less palatable. They might need to:
Contribute 13% and plan to retire at 68 OR Contribute 18% and plan to retire at 65
What chance is a good chance? And what does it cost?
I said I’d get back to those odds. A 50/50 chance of achieving your retirement target doesn’t feel all that compelling, does it? Would you bet your standard of living in retirement on the toss of a coin?
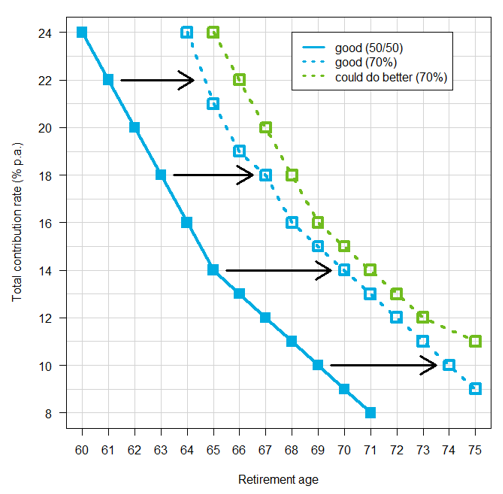
What if we set the bar higher? Let’s assume the same member now wants more certainty around achieving their target - a 70% chance, say.
The result is that the GO Frontier shifts to the right because contributions need to be higher and retirement dates later to increase the member’s odds of success.

And the difference is stark.
Assuming SPA retirement and a good strategy, the member needs to contribute 5% p.a. more (11% to 16%) to increase their chance of success from c.50% to c.70%.
And an additional 2% p.a. would then be required to compensate for an inadequate investment strategy.
Assuming 12% contributions and a good strategy, the member would need to defer retirement for c.5 years (from 67 to 72) to improve their odds in a similar way.
And an extra year of work would then be required to compensate for a poorly designed strategy.
In summary
So, what have we learned?
- The implications for members of a sub-optimal investment strategy are potentially significant and can be expressed in well understood terms – the currency of contributions and retirement age.
- Members might need to make unwelcome changes to their contribution rate and/or retirement age to compensate for an inadequate investment strategy.
- Increasing certainty of outcome can be costly, even with a well-designed strategy in place.
- Members are therefore faced with potentially onerous contributions and difficult decisions around when they can retire to give themselves a fighting chance of achieving their retirement goals. They can ill afford to compound that problem by investing in an inappropriate strategy.
What next?
I’d encourage members to engage with their employer on the appropriateness of their default solution and to understand how it supports their retirement goals.
They should also look for strong, outcomes-focused governance, which demonstrates employer accountability and is key to ensuring that a strategy delivers (and continues to deliver) for members.
For more information about this article, please get in touch, or contact your usual Hymans Robertson consultant.
1DC trust: scheme return data 2019-2020, The Pensions Regulator
2Approximately £20k of annual expenditure based on a single person living outside London


0 comments on this post